تحلیل آماری و نحوه گزارش Multiple Regression Analysis
Interpreting and Reporting the Output of Multiple Regression Analysis
SPSS Statistics will generate quite a few tables of output for a multiple regression analysis. In this section, we show you only the three main tables required to understand your results from the multiple regression procedure, assuming that no assumptions have been violated. A complete explanation of the output you have to interpret when checking your data for the eight assumptions required to carry out multiple regression is provided in our enhanced guide. This includes relevant scatterplots and partial regression plots, histogram (with superimposed normal curve), Normal P-P Plot and Normal Q-Q Plot, correlation coefficients and Tolerance/VIF values, casewise diagnostics and studentized deleted residuals.
However, in this "quick start" guide, we focus only on the three main tables you need to understand your multiple regression results, assuming that your data has already met the eight assumptions required for multiple regression to give you a valid result:
Determining how well the model fits
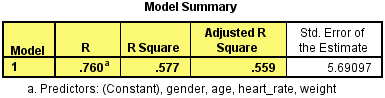
The first table of interest is the Model Summary table. This table provides the R, R2, adjusted R2, and the standard error of the estimate, which can be used to determine how well a regression model fits the data:
Published with written permission from SPSS Statistics, IBM Corporation.
The "R" column represents the value of R, the multiple correlation coefficient. R can be considered to be one measure of the quality of the prediction of the dependent variable; in this case, VO2max. A value of 0.760, in this example, indicates a good level of prediction. The "R Square" column represents the R2 value (also called the coefficient of determination), which is the proportion of variance in the dependent variable that can be explained by the independent variables (technically, it is the proportion of variation accounted for by the regression model above and beyond the mean model). You can see from our value of 0.577 that our independent variables explain 57.7% of the variability of our dependent variable, VO2max. However, you also need to be able to interpret "Adjusted R Square" (adj. R2) to accurately report your data. We explain the reasons for this, as well as the output, in our enhanced multiple regression guide.
Statistical significance
The F-ratio in the ANOVA table (see below) tests whether the overall regression model is a good fit for the data. The table shows that the independent variables statistically significantly predict the dependent variable, F(4, 95) = 32.393, p < .0005 (i.e., the regression model is a good fit of the data).

Published with written permission from SPSS Statistics, IBM Corporation.
Estimated model coefficients
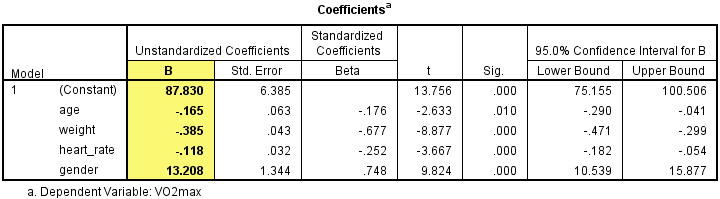
The general form of the equation to predict VO2max from age, weight, heart_rate, gender, is:
predicted VO2max = 87.83 – (0.165 x age) – (0.385 x weight) – (0.118 x heart_rate) + (13.208 x gender)
This is obtained from the Coefficients table, as shown below:
Published with written permission from SPSS Statistics, IBM Corporation.
Unstandardized coefficients indicate how much the dependent variable varies with an independent variable when all other independent variables are held constant. Consider the effect of age in this example. The unstandardized coefficient, B1, for age is equal to -0.165 (see Coefficients table). This means that for each one year increase in age, there is a decrease in VO2max of 0.165 ml/min/kg.
Statistical significance of the independent variables
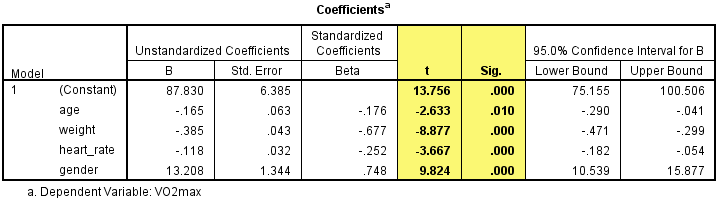
You can test for the statistical significance of each of the independent variables. This tests whether the unstandardized (or standardized) coefficients are equal to 0 (zero) in the population. If p < .05, you can conclude that the coefficients are statistically significantly different to 0 (zero). The t-value and corresponding p-value are located in the "t" and "Sig." columns, respectively, as highlighted below:
Published with written permission from SPSS Statistics, IBM Corporation.
You can see from the "Sig." column that all independent variable coefficients are statistically significantly different from 0 (zero). Although the intercept, B0, is tested for statistical significance, this is rarely an important or interesting finding.